
How is energy consumption affected by the weather and how do I check this?
1. Login to the Dashboard > Graph.
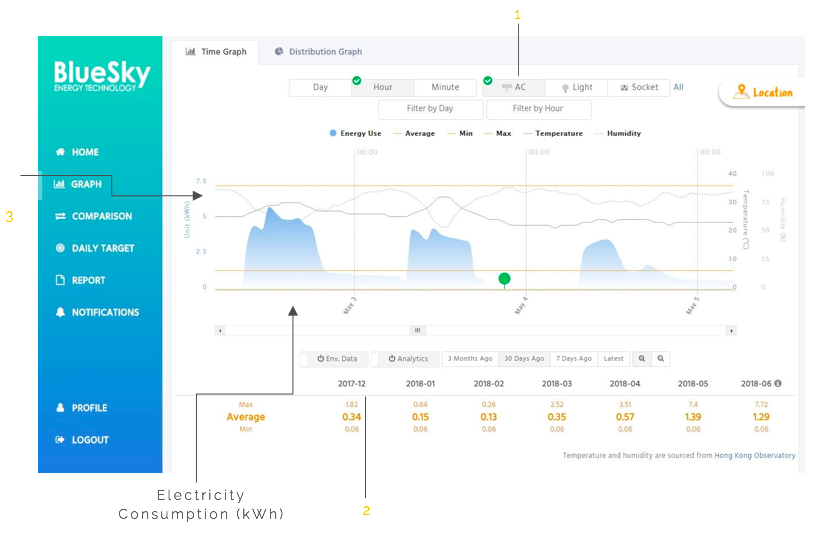
2. Select your desired time frame: Day, Hour or Minute.
3. Select AC.
4. Select Env Data.
5. On the graph, there are two gray lines:
• Solid gray line indicates Temperature
• Dotted gray line indicates Relative Humidity
6. Examine the graph’s trends. If Temperature or Relative Humidity have gone up along with the AC’s energy consumption, energy consumption has increased due to the warm weather, and vice versa.
7. Alternatively, select Socket to examine the energy consumption of the water boiler, heater, etc., which require more energy in colder weather.
Tip: Does your graph show comparatively lower energy consumption during hot weather? Achievement unlocked! Share this accomplishment with your friends.